We at Sensorsix have built a tool for ambient intelligence. Ambient intelligence is knowledge about what goes on around us. In our case it is built on what we can learn about human mobility from sensors. We have been in stealth until now working on a prototype to quantify the flow of human movement in particular traffic. Basically we use Machine Learning to extract information from video feeds to measure the volume of vehicles, pedestrian bikes etc. across time on select locations.
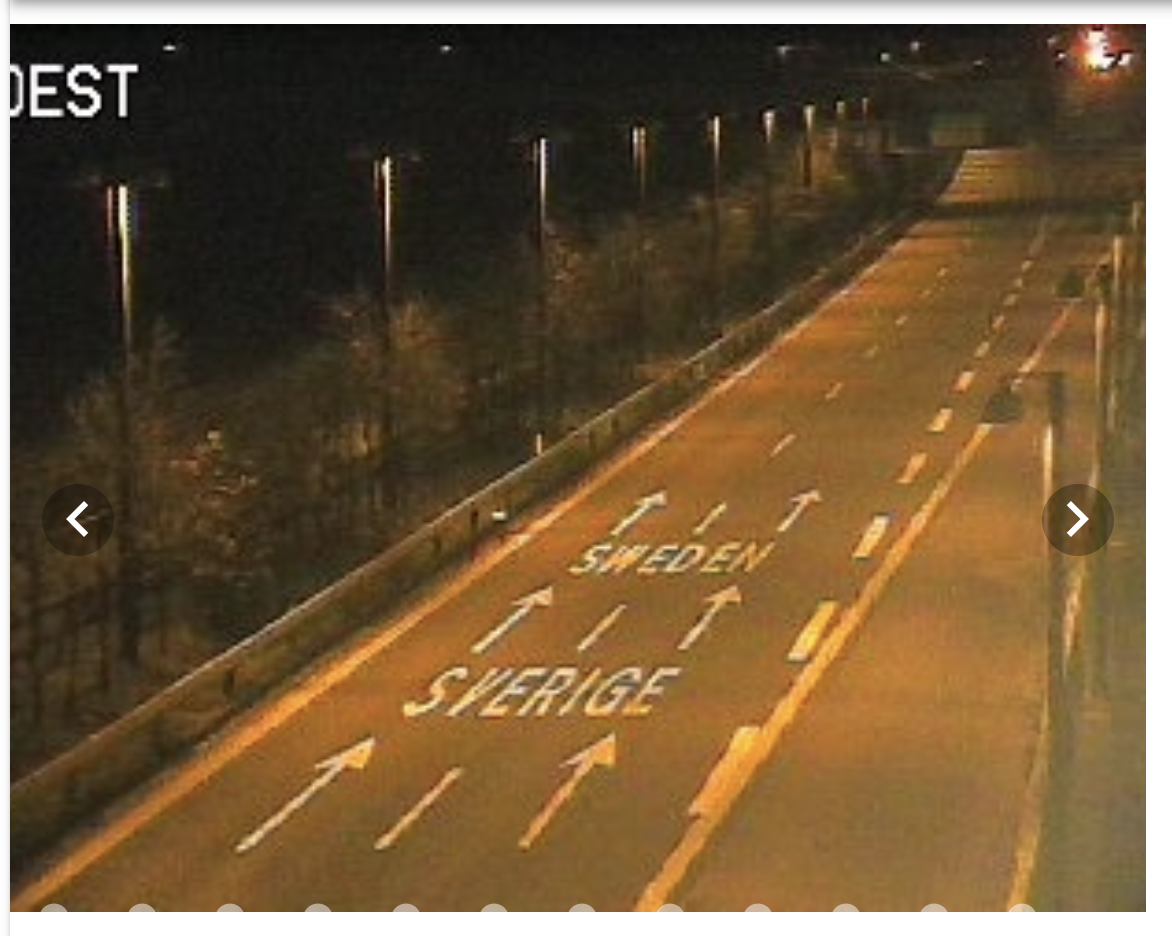
As part of our testing of the product we had set up monitoring of the region of Zealand in Denmark. For those unfamiliar with the geography of Demark, Zealand is an island on which the capitol region of Copenhagen is located. The region is home to almost 2,3 million people. We wanted to understand the ebb and flow of traffic, the heartbeat of the region if you will.
We started this test on Sunday March 8th. On the evening of March 11th the prime minister of Denmark, Mette Frederiksen, closed all schools and required all public employees to work from home. Most schools and institutions closed down already the following day. On Friday the 13th at noon the borders to our neighboring countries were closed as well. Since Zealand is next to and deeply integrated with Sweden these two events would be expected to have a significant impact on mobility in the Zealand region.
Since we were monitoring the traffic from before the decision, we are able to accurately quantify and visualize the flow of traffic. The figure below that displays traffic volume from noon Sunday March 8th until noon Sunday March 15th. For reasons of simplicity we chose to focus on cars, so the figure only displays cars. Different patterns may exist for other types of vehicles, but the majority of traffic is cars.
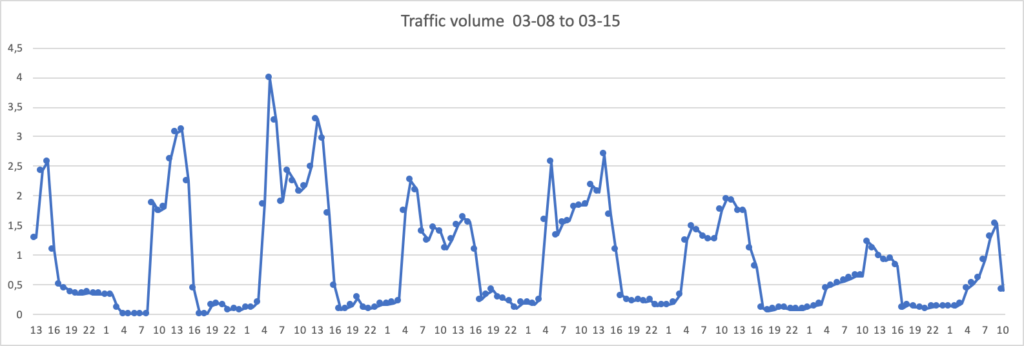
When we look at the pattern, what we see is the usual heartbeat of a city. Previous research and our own pilots in New York have shown the same pattern where traffic increases in the morning, has a noon dip and then rises in the afternoon and evening. But it is clear that even if the pattern is recognizable, the heartbeat is losing power. Just how much may be clearer from the figure below. Here we see a jaw breaking drop of about 75% in traffic volume.
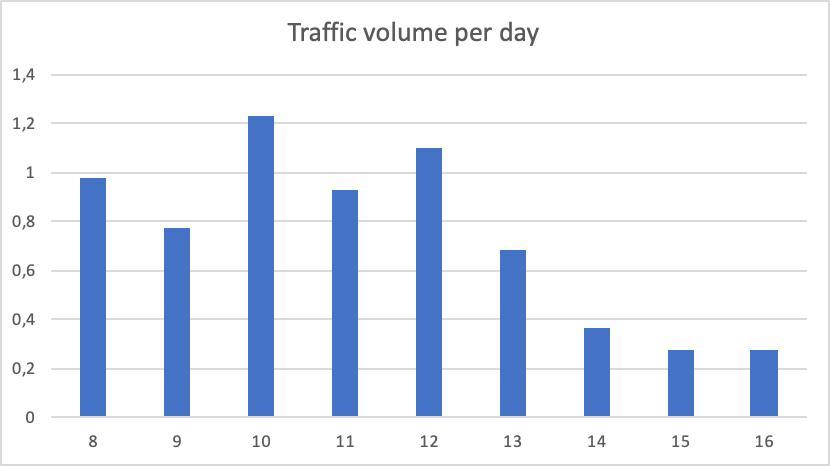
These are just some preliminary findings that we wanted to share for reflection and in the service of public information. Based on our data we can see that this is not a drill! It is not fake news. It is not tendentious journalism finding a deserted or heavily trafficked road depending on what they want to see. It is not exaggerated and it is not played down. it is a 75% drop regardless of how you frame it. In these times of fake news it is all the more important to get solid facts on the table. This is exactly what we built sensor six for. In all modesty we are probably the only ones in the world who can tell what actually goes on in traffic.
What can this be used for?
A fair question is therefore what we can use this data for. Is it just another piece of data to throw on the heap? We think not. In the current Corona context, there are at least three key issues that solid ambient intelligence can help solve
Compliance – do people really stay at home or do they ignore the orders political leaders are giving them? This is an interesting way to provide a fact-based way of monitoring the efficiency and compliance of curfew and other measures of limiting trafic.
Efficiency – since this is a good proxy for degree of quarantine a society is enforcing it is potentially an important metric. The frequency of interaction between people is an important variable in the spread of an epidemic disease and understanding the trends in mobility will give an indication about what that is. We should be able to correlate with the effect on number of infections and morbidity in the longer term. Obviously the effect will be delayed.
Economic activity – it should be possible to correlate the flow of traffic with economic activity. Initially it will of course be a drop and similarly the effect will be delayed. We can use the data to understand the economic impact a drop has. Eventually it should turn around and the rise in traffic volume should be the first harbinger of increase in economic activity.
We will keep monitoring the traffic and supply other interesting insights that we can mine from our data.
Note on methodology: we are continually monitoring roads leading to all entry points to and exit points from Zealand, which means all bridges and major ports. All traffic that comes into or goes out of the Zealand region is quantified. Based on this data we generate a volume score that is tracked continually