
It seems evident we are on our way to a recession . This will prove a challenge for many, and our world economies will suffer. Not least the stock market. We are similarly probably headed for a bear market.
But the stock market is ahead of the curve and typically turns around about 5 months before the recession ends. For investors it is therefore important to look for indicators of when the current bear market is turning around since no one wants to invest in a bear market.
Since this is a unique situation we haven’t been in before we need to look for unique indicators. It has been suggested by Supertrends Institute that we should look for numbers such as number of new cases, new hospitalizations and number of deaths to start declining but since the world treats this very differently across nations it may be difficult to find out what countries to look for or whether to look for the total. Looking for the global decline may be misleading since the economic impact of countries may differ. A massive outbreak in Venezuela may cloud that view, since the economic integration of that country is not significant.
Furthermore, there may be a lag between this point and when people actually feel comfortable going out. Consequently, we should look at other more robust indicators. One suggestion is looking at what can be inferred from traffic data. But should we just look at google/Waze data or telecom data to tell us the raw volume? That would be an indication of when traffic starts to pick up again. That is true. It is also however a data source with severe limitations. First of all, none of them have a complete view of traffic. Google and Waze only monitor its user base and can apparently easily be deceived as was recently demonstrated in Berlin. Telecoms only know what goes through their own networks not their competitors’. Second, all of these data sources know nothing about what sort of vehicle is moving. From an economic point of view, it makes a big difference whether the movement comes from a person in a bus, a car, a motor cycle or a truck, since trucks are reliable indicators that goods are moving around. All the others are not.
It is not enough to look for a surge in traffic in order to spot a turnaround in the economy., This could be motor bikes or cars. What we are looking for is a surge in trucks, since trucks bring goods to stores and only when stores again receive goods will we know that people started spending.
None of the existing solutions actually tell you what goes on in traffic. This is why we developed sensorsix to monitor not only traffic flow but also the composition of traffic. We monitor at the number of different types of vehicles at any given time through a network of traffic cameras.
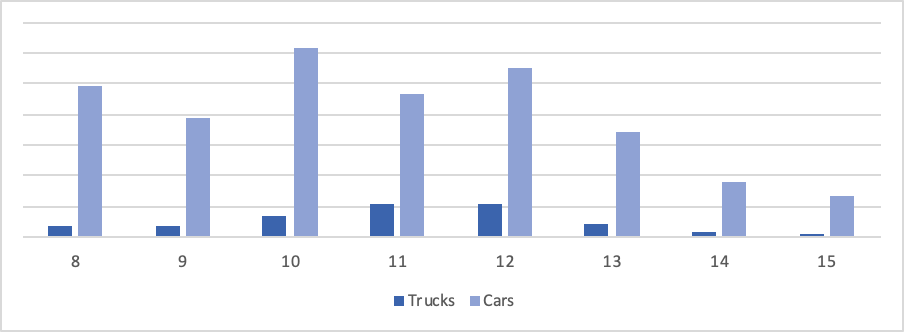
The effects can be seen pretty clearly. One example is how the traffic quickly fell after Denmark was put on lock down. This figure shows the volume of truck and car traffic on Zealand in March. On the evening of the 11th Prime minister Mette Frederiksen announced that all public workplaces would shut down and employee s work from home. On the 13th borders closed. This resulted in a significant drop that echoes the decrease in demand due to the lock down of restaurants, cafes and most stores. While it was not illegal to drive around it is clear that truck traffic dropped much more than car traffic. IF we were just measuring the total volume of traffic that may not have been apparent.
Another example is from New York where we measured traffic in the whole city. Here is an illustrative sample from December.
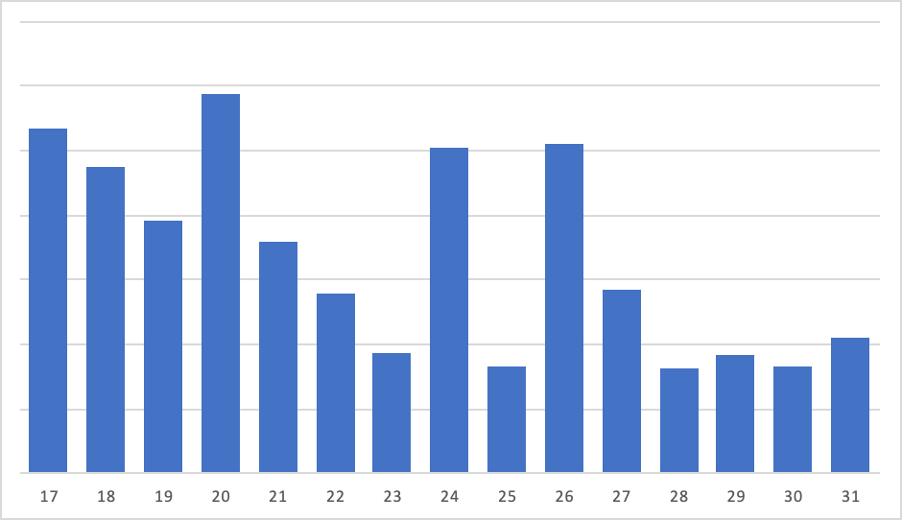
We can see a lot of truck traffic in the days leading up to Christmas day right until the last day where people are shopping. Then again after Christmas we see a similarly high number of trucks presumably carrying returned gifts, but then traffic is levelling off the rest of the month all the way down to the level of Christmas day because of the sudden decrease in demand.
These are just illustrative examples of the correlation between truck traffic and demand. We would expect to see a surge in truck traffic when the economy of our cities are really picking up and not until then.