One thing that you quickly realise when you are trying to build a solid data offering is that data is not just data. Just like food is not just food and clothes not just clothes. A Metallica T-shirt is fine if you are going to sit on your couch and watch football with your bro, but not so much for a job interview (or maybe it is if you are looking for a cryptocurrency gig). Conversely foie gras may be great for a special occasion and a romantic candle lit dinner but not ideal for a lunch box to take on a fishing hike with grandpa.
The “same” data can be fine in one context but not in another. The key is to determine and improve the “value” of data. Traditionally the value of data has been conceived along the lines of quality that is integrity and consistency. This I still consider to be fundamental and important, but working in the real world you will discover that even the highest quality of data imaginable may not necessarily be valuable. Data has more to it than that. The value of data can be conceived of along with the following 7 dimensions.
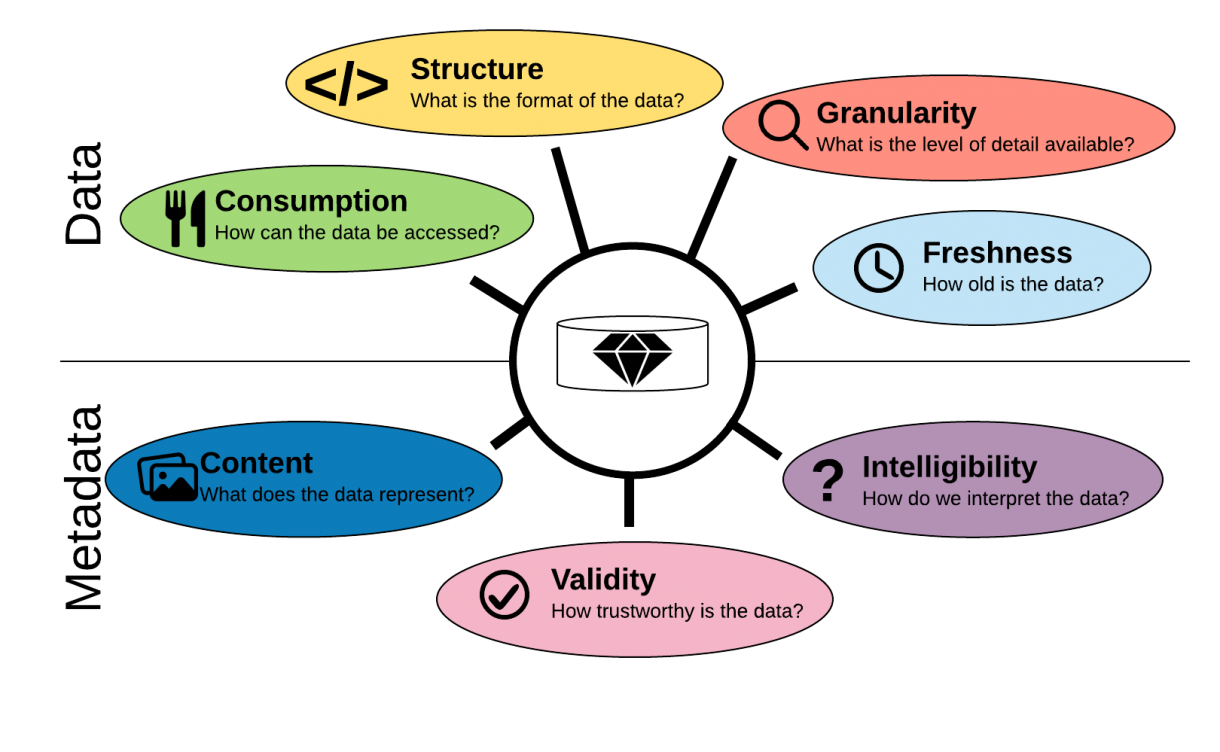
- Consumption
- Structure
- Granularity
- Freshness
- Content
- Validity
- Intelligibility
The 7 dimensions of data value
Consumption. For some users it makes most sense to consume data from a REST API. For example if you are building mobile apps. But if you are a data scientist chances are that it will be better for you to read a file on a URL or through FTP. There is also a difference in whether you want to pull the data after your own schedule or you want it pushed to you. Often companies have a policy never to allow anyone to push data to them.
Structure. The structure of the data will make a big difference as well since different systems and use cases call for different structures. In certain cases a CSV format is preferable, there are good reasons why a JSON format may be better if the data has a nested nature to it. For analytical purposes a database structure that can be accessed in SQL is necessary if the typical use case is ad hoc access to a subset of a data or if the data is derived from different datasets and joined.
Granularity. the granularity of data describes the level of detail in terms of time, place, aggregation. The more granular the data the more valuable, because you can always aggregate from a lower level of granularity to a higher. An example of granularity is time. Let us say you count something happening, like products on an assembly line for many types of use it may be fine to have counts per quarter hour, but for certain applications like anomaly detection it is necessary to go deeper. The lowest level is the individual timestamped count. An extreme version of getting to lower levels of granularity is the Large Hadron Collider. Here we go down to the sub atomic level of data in order to solve the basic questions of nature
Freshness.– This describes the time the data is available from the time of the event that is the object of the data. If we are talking about stocks for example, incredible amounts of energy is dedicated to increase the freshness. This is what is driving high frequency trading. The faster you can detect signals in the market the better. In order to detect signals fast you need to decrease the time from an order is fulfilled to the time the information of it is available. This is the entire plot of Michael Lewis’ excellent book “Flashboys”.
Content. This is a non trivial matter but also a self evident one. Let’s start from the bottom, if you don’t know what the data represents it is completely worthless. The first step is to be completely clear what the data represents in the real (or virtual) world. This is often communicated in data dictionaries or in data catalogs. Next step is to find applications of that data or the utility. This is more tricky because it often depends on vision and imagination on behalf of the potential user. The utility of data is always tied to a business problem and works from there.
Validity. This dimension aims at the extent to which the data can be trusted. It measures whether the data is a valid expression of an underlying event or observation. If we have data about temperatur measurements we want to understand what the margin of error is for the sensor, but also if that sensor or something else in the data pipeline is malfunctioning or configured wrongly. This is why data scientists often obsess about where their data is coming from to understand the validity of it.
Intelligibility. Do we know how to interpret the data? While we may know that a field measures distance, do we know for sure the unit it is measured in. This is what went wrong for the Mars Climate Orbiter: one team was using american units of measurement, while the other was using the metric system. Other examples are sensor readings, where it is necessary to understand exactly what a reading means, even if we know what it measures, like a substance: is it parts per million, volume or something else like electrical resistance.
Strategies for optimizing data quality across the 7 dimensions of data
What we can learn from this is to make sure when we are offering data for consumers that we optimize the value for them. There are some things we can do from an architectural stand point to increase the value of data.
- Store once– open consumption. Store data once and make it consumable in multiple ways. Rather than generating multiple versions of the data we should aim to have one version of the data that can be consumed in multiple different ways. Multiple versions will lead to higher latency and increased risk of data differing across consumption methods. An example is an API returning a different reading than a database or a file. If data comes from the same source there will be no possibility for errors. That said, we also have to realize that some use cases warrant specific storage to optimize for other value dimensions like freshness or structure.
- Use the lowest granularity. This is nothing new but worth mentioning since todays technology has eliminated most needs for aggregation that existed in the past. Whereas in earlier times we needed to store different aggregation levels for our cubes used for reporting, technologies like columnar storage and in memory data processing has eliminated much of the need that existed earlier. Today there is no real reason not to store the lowest granularity. This is what we see in the Extract, Load Transform paradigm. Just store the raw data first. If transformations, aggregations or validations are needed it can be done subsequently and frequently at the time of query.
- Make data discoverable. There should be processes in place to make sure that any data asset offered will not be published until the nature of that data is understood. Unknown data is useless anyway and therefore merely noise. The recent flurry of attention around data catalogs are proof that organizations are realizing that a quick and necessary way to increase the value of the data they already have is to describe it in a data catalog. In a data catalog it is possible to document and maintain meta data that describes the content of a data source and increase intelligibility.
- Promote data lineage transparency. Data lineage is always going to be a challenge since data will come from multiple source system through different processes, but it is a necessary step to increase the validity of data being used. An end user must be able to understand the source of the data and what happens to it in the data pipeline before it reaches the user.
- Real time first. Batch processing is a soothing thought for most analytics people, but we have to force ourselves to start thinking about realtime first. This often means new tools and techniques. The reason for this is to increase the freshness of data. More and more applications need fresh data. When the AI industry is moving towards predictive and prescriptive analytics it is necessary to be up to date. As is the case with higher granularity of data, you can always aggregate the real time data in chunks of time or batch it later. But you can never move from batch to real time.
Improving data value, not just data quality
While we are preparing for the on-coming data deluge and data quality is a current area of focus, we need to start thinking about how we increase not just the quality but the value of the data. Data quality is definitely a piece of the value, but as this analysis has shown not the only one. For conceptualizing data value we need a clear understanding of what makes data valuable and strategies and architectures to improve the quality of data. The seven dimensions of data value described above is a way to keep data value at the center of attention and have something concrete to measure. The five strategies for improving data value are just a list of non-exhaustive approaches that can be taken to make the process of data value creation more tangible.
We need to start focussing on the value of data if we are going to let robots drive our cars, automate our homes and in general penetrate ever deeper into our lives.
Edit June 10 2019: Based on the great interest this piece generated I created the Data value Scorecard as a practical tool to describe and manage the improvement of data value. See more at www.datavaluescorecard.com